Demo version
The demo version allows
using the data input and output options, but do not allow to create a new
system, or to run new calculations. The demo version contains the documentation
in French and in English. Like the Professional and the Research and
Educational version, the interfaces can be switched, at any time, into French,
English or Spanish.
Installation:
|
|
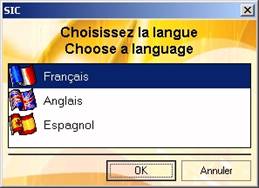
The installation of the
demo version can be done in French (Français), English (Anglais) or Spanish
(Espagnol). Whatever the selected option, the Sic software will then be able
to speak all 3 languages. Through the option menu of Sic you will be able to switch
between the 3 languages. |
|
|
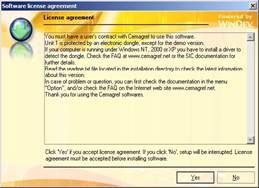
The License agreement
notice is displayed. For the demo version it has no special constraints. |
|
|
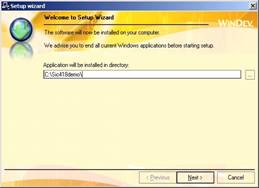
You must then specify
where you want to install the software. The installation procedure will write
all the sic files into this directory. |
|
|
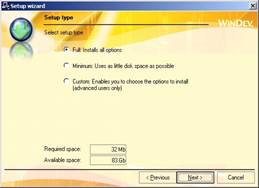
You can then select the
installation options. By default we suggest to install full options. |
|
|
A summary of the
installation options is displayed for validation. |
|
|
You can then decide what
to do after the installation. |
|
|
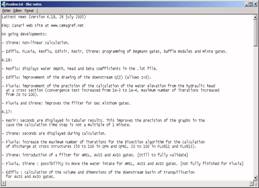
If you have selected to
display the Readme file, you get this file displayed. It gives you
information on the latest developments of the software and the differences
between the different versions. This file is also located into the Sic
installation directory and you can visualise it at any time. |


Main
program:
|
|
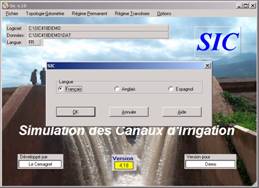
When you run Sic, it may
be in French, English or Spanish. To switch into your favourite language you
can select the "language" ("langue" or "idioma")
option into the options menu or by clicking on the "FR"
"GB" or "ES" language button in the main Sic frame. |
|
|
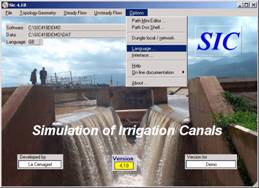
Language option into the
options menu. |
|
|
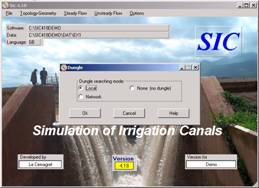
The dungle option (from
the options menu) should be switched into "local" option if you
want to have access to the Topology – Geometry menu. You will get an error
message since no dungle is provided with this demo version, which is normal. |
|
|
Five data examples are
provided (Ex1 to Ex5 under the Dat subdirectory). To switch from one to the
other one you may use the "File / Data Directory" option, of click
on the Data button on the main Sic frame. |

Unit
1 - Topology and Geometry:
|
|
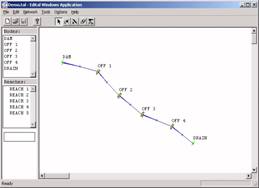
The example is based on a
simple linear 5-reach canal. But any size and any shape is allowed including
branches and loops. |
|
|
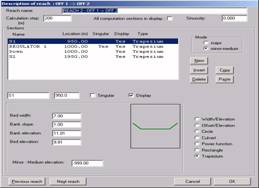
The cross sections are trapezoidal
ones, but any shape is allowed for example using the width-elevation or
abscissa-elevation option. |
Unit
2 - Steady flow:
|
|
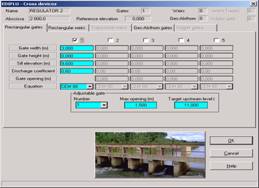
Cross structures can be defined
including several rectangular gates, rectangular weirs or Gec-Alsthom gates
in parallel. You can also have a picture of your real structure if you want. |
|
|
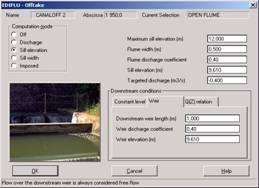
Offtake structures can
also be defined. Many type of devices are proposed and, more interesting,
several calculation options are allowed. A downstream boundary condition can
also be given if the offtake can be submerged, without describing in details
the downstream lateral canal. |
|
|
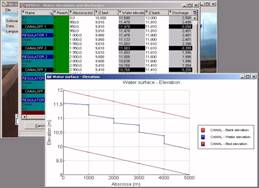
Steady flow results can
be visualized in different format. Back water curves can be visualized in
numerical and graphical format. All these data can be exported into different
format (.wmf, .bmp, .emf, .xml, .doc, ascii .lot or .lst files, autocad .dxf
files, etc.). |
|
|
Results can be also
visualized at offtakes or cross structures devices. |

Unit
3 - Unsteady flow:
|
|
Offtake or structures
time modifications (any internal or external boundary condition) can be
specified in a time series format. |
|
|
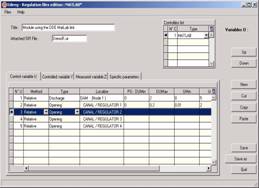
These modifications can
also be defined through what we call "regulation modules", which
means that the modifications will be done using an algorithm and some
measurements done real-time on the canal. The algorithm can be selected among
a large number of pre-programmed ones, or can be written by you in Fortran or
in a MatLab .m file in a very simple way. The algorithm library includes any
LTI discrete state space controller, a scada interface, manual operation,
complete PID controllers including antiwindup and autotuning, etc. |
|
|
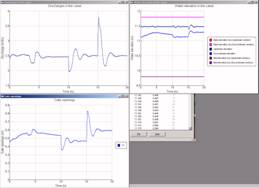
Unsteady flow results can
be displayed locally at any location as a function of time. |
|
|
Unsteady flow results can
be displayed globally for example the maximum and minimum values during any
selected time period. |
|
|
Cross and lateral devices
operations can also be summarized giving a quick idea on what has been moving
along the canal. |
|
|
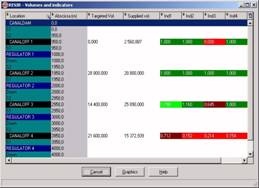
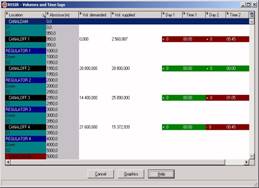
Performance indicators
are also displayed. You can parameterize these performance indicators if you
which. They have been defined in collaboration with the International Water
Management Institute. |
|
|
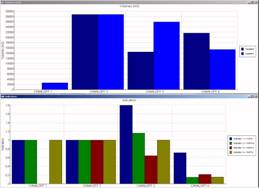
These performance indicators
can also been displayed as graphs, and exported as for the steady flow
results. |
|
|
Performance indicators
such as time lags are also calculated. |


Conclusion: These are just a small part of the
options proposed by the Sic hydrodynamic software making it certainly the most
complete and powerful software dedicated to irrigation canal and river
modelling and control. By playing with the demo version you will not be able to
run new calculations, but you will be able to see all input and output options.
If you have specific requirements we also will be pleased to discuss them with
you.
![]()
Pierre-Olivier Malaterre home page | CANARI server